In our related story: ‘Where are we now? – Global profits: Recession or Rebound?’ - we have seen how the overall global profit picture (and therefore overall global pricing) is driven mainly by two relatively boring sectors – banks and fossil fuel producers, rather than the attention-grabbing US tech-online stars.
However the US is still critically important to the overall global picture as US companies make up 60% of the global stock market value.
It is notable that US companies contribute less than half of global profits and dividends, because they are more expensive per dollar of profits and dividends, as we see below.
Are the latest US profits allowing for a slowdown?" asks Ashley Owen
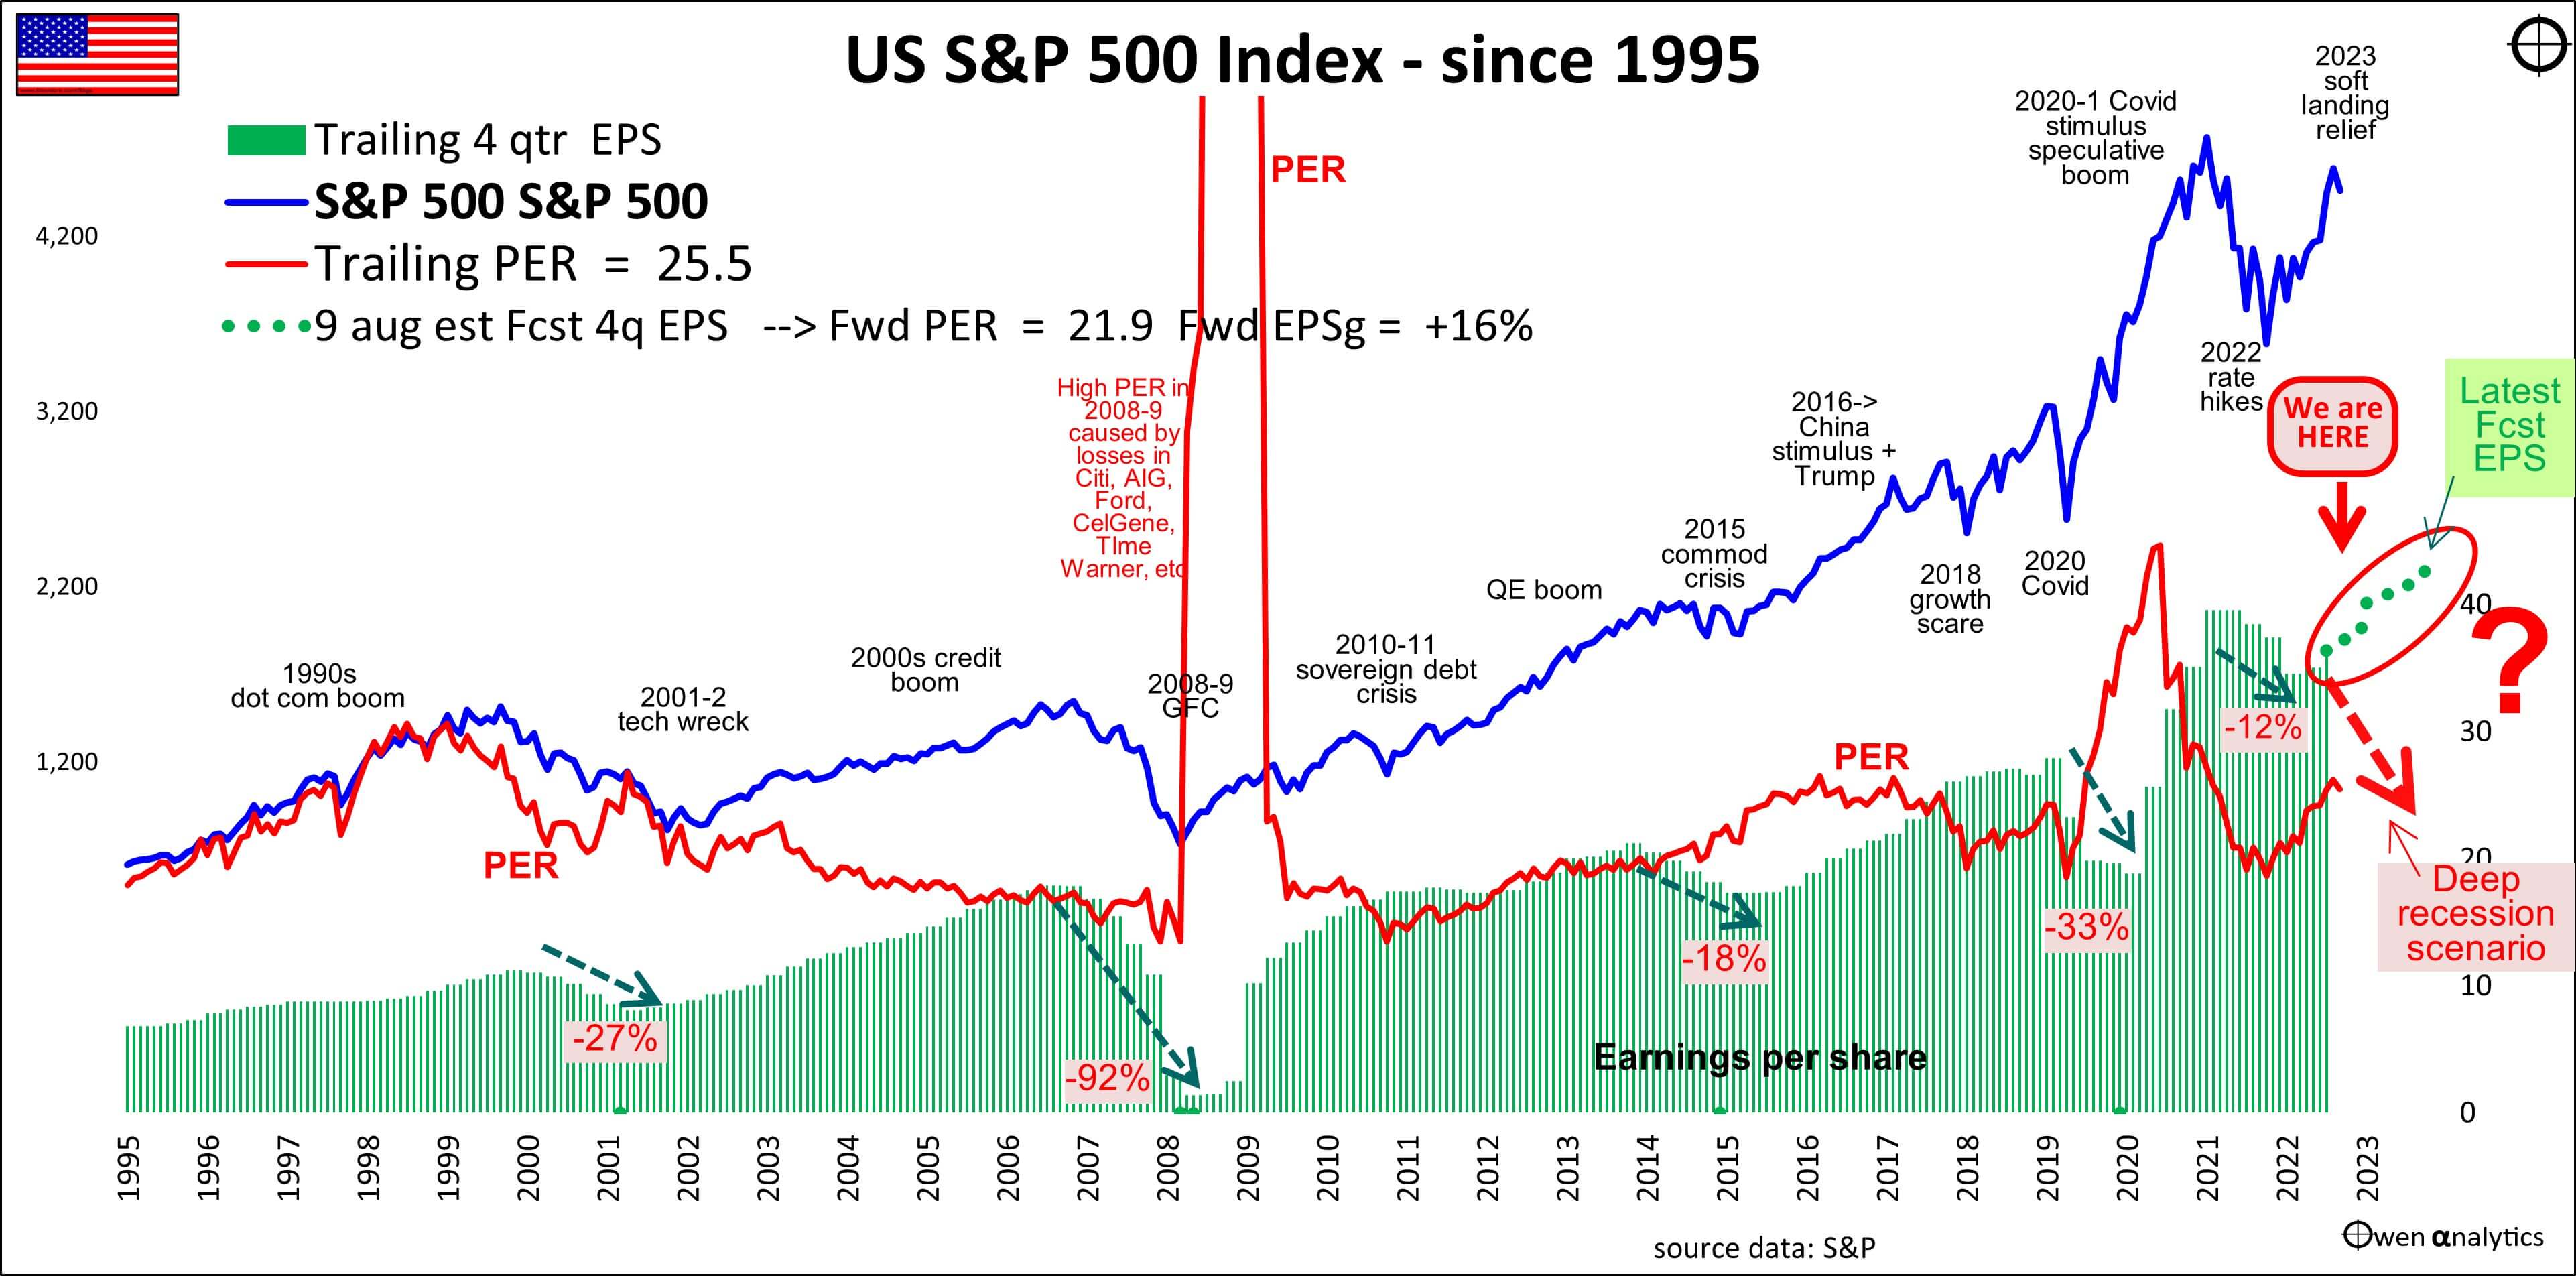
Here is our snapshot of the US S&P500 profit and pricing picture over the past three decades, to see where we are now.
NOTE: The blue line is the price index, the green bars are aggregate 12-month rolling earnings (profits) per share, and the red line is the price/earnings ratio – i.e. how much (price index) the market pays per dollar of earnings (green bars).
Where are we now for share prices?
To the right of the chart, we can see that the price index (blue line) fell sharply in 2022 (aggressive rate hikes to attack inflation), but has rebounded in 2023 (slowing of rate hikes with easing inflation), and is now almost back to the 2021 boom-time peak (Covid stimulus hand-outs and zero interest rates).
By Ashley Owen, CFA


Where are we now for pricing (price/earnings ratios)?
The red line shows the ‘trailing’ price/earnings ratio (ie current price relative to the most recent 12 months profits). This is now back up to a rather expensive 25.5 times trailing earnings.
This is at least down from the astronomical 44.7 p/e ratio in May 2021 at the top of the post-Covid speculative bubble, but is still very high/expensive.
The current ‘forward price/earnings ratio’ (current price relative to forecast next 12 months profits) is more important because we buy shares for future, not past, profits.
The forward p/e is now 22 times forward profits, which assumes aggregate profits will grow by +16% over the coming year.
Company profits in recession cycles
The reason for using this chart over three decades is to show what recent recessions have done to aggregate corporate earnings, and in particular, what they have done to share prices.
In the last three major US (and global) recessions, aggregate earnings per share (green bars) fell by -27% in the 2021-2 ‘tech-wreck’, by -91% in the 2008-9 GFC, and by -33% in the brief 2020 Covid recession.
These profit cuts were enough to take the US share market down heavily in each case: the S&P500 index fell by -49% in the tech-wreck, -57% in the GFC, and -34% in Covid.
(Share prices generally fall before profit cuts are reported, and then rebound out of the middle of recessions, in a sea of losses before profits recover).
In 2022, the US share market fell by -25% from the start of the year to the end of September. However, as soon as the Fed started to slow its rate hikes on signs of easing inflation (October 2022) investors piled back into shares again, driving the rebound back into expensive territory.
Where are we now for US profits?
For profits, we are at a major fork in the road.
We are now at the right-hand end of the green bars (aggregate earnings per share) on the US chart. The green dots show current consensus forecast earnings per share rapidly rebounding to new highs over the coming year. That’s not a ‘soft landing’ – that’s a profit boom even bigger and better than the speculative boom in 2021 that was fuelled by Covid stimulus hand-outs and zero rates!
On the other hand, the large red arrow starting from the same point, shows what aggregate profits are likely to do in the event of another deep recession. This is not being alarmist, it is simply a reflection of what has happened to overall corporate profits in numerous previous recessions.
In the event of a major cut profits in a recession, share prices would probably fall heavily leading into it, as in past cycles.
If the US does have a deep recession in the coming year - complete with the usual big cuts to spending, jobs, revenues, profits, dividends - the government may not be willing or able to ramp up deficit spending again like it did in 2020, with debt ceiling problems ever-present now.
On the monetary side, the Fed may not be willing or able to cut rates to zero again, especially if inflation remains ‘sticky’. These risks are not allowed for in the current level of share market pricing.
Thus far, company revenues, profits and dividends are holding up, supported by relatively strong employment and spending. Watch for our regular reports on progress.
Australia next
This story focused on US profits, not only because US companies dominate global share markets, but also because what happens in the US ricochets around the world, regardless of local conditions and pricing. We are now in the August reporting season in Australia, and we will report on the outcomes and implications next month. Stay tuned!
About
This article is written by Ashley Owen, CFA and the views expressed are his own.
Ashley is a well known Australias market commentator with over 40 years experience.
Membership & associations:
• CFA charter holder
• Signatory to the UN Principles for Responsible Investment
• Occasional member, Education Advisory Board Working Committee of the CFA Institute (US)

